Click here to view the PDF of the full study.
Does Michigan devote enough money to primary and secondary education? Do school districts receive enough revenue to ensure the vast majority of enrolled students graduate college or career ready? How much does it cost to provide a quality educational experience? These are the types of questions for which the Michigan Legislature recently paid nearly $400,000 to obtain some answers.
These answers would clearly be helpful to policymakers who determine how many tax dollars to allocate to schools. But these concerns about the adequate level of school funding are based in part on the common assumption that spending more on K-12 schools will generate better academic outcomes. A more fundamental question that policymakers might want to answer before determining the appropriate level of funding for schools is: What is the relationship between school spending and student achievement in Michigan?
That is the question this paper attempts to answer.
To read a response to a critique of this study, click here.
Does Michigan devote enough money to primary and secondary education? Do school districts receive enough revenue to ensure the vast majority of enrolled students graduate college or career ready? How much does it cost to provide a quality educational experience? These are the types of questions for which the Michigan Legislature recently paid nearly $400,000 to obtain some answers.
These answers would clearly be helpful to policymakers who determine how many tax dollars to allocate to schools. But these concerns about the adequate level of school funding are based in part on the common assumption that spending more on K-12 schools will generate better academic outcomes. A more fundamental question that policymakers might want to answer before determining the appropriate level of funding for schools is: What is the relationship between school spending and student achievement in Michigan?
That is the question this paper attempts to answer.
The bulk of the research on this question has typically shown that there is little correlation between spending and achievement, but it is possible that Michigan’s public schools are an exception to this finding. To test this hypothesis, this study uses a large data set containing detailed spending, standardized test scores and student demographic information from more than 4,000 individual public schools in Michigan from 2007 to 2013. Using building-level data, as opposed to data grouped at the district level, allows for a more precise examination of the relationship between school spending and student achievement.
The study employs a multiple regression analysis to examine whether the data show a relationship between school spending and student achievement. It looks for a statistically significant correlation between how much an individual school spends per pupil and how well its students perform on one or more of 28 measurements of academic achievement. The indicators include results from three different standardized tests as well as graduation rates for high school students.
The results from this analysis of recent Michigan-specific data suggest that there is no statistically significant correlation between how much money public schools in Michigan spend and how well students perform academically. This finding is consistent with what the bulk of previous research has found. The results from this analysis suggest that student achievement is unlikely to improve by simply spending more on Michigan’s current public school system, all else being equal.
The bulk of the academic research suggests that there is no statistically meaningful correlation between school spending and student outcomes. In cases where the correlation is positive and statistically significant, the effects are quite small — suggesting that even large increases in spending are likely to translate into only small academic effects, on average.
One of the nation’s foremost experts on this issue is Stanford University’s Eric Hanushek. In 1997 Hanushek comprehensively reviewed the academic research on the relationship between school resources and student outcomes, which are most often measured by standardized test scores but sometimes include measures of graduation rates and future job earnings. Hanushek examined 377 studies that attempted to measure the relationship between school resources (per-pupil spending, teacher-pupil ratios, teacher experience, etc.) and student performance and controlled for factors that are known to impact student achievement, such as family background. Of the 377 studies, 163 specifically measured the impact of per-pupil spending on student performance. Twenty-seven percent of these 163 studies showed a statistically significant positive relationship. Another 7 percent found a statistically significant negative correlation — meaning the more schools spent, the worse students tended to perform on average. The remaining studies — two-thirds, or 66 percent — found no statistically significant correlation between per-pupil spending and student achievement.[1]
Of these 163 studies, 83 measured per-pupil spending and student performance at the school-building level — as this analysis does. Of these 83, Hanushek reported that just 17 percent found a positive and statistically significant correlation between spending and achievement, while 7 percent found a statistically significant but negative correlation. More than three-quarters, 76 percent, of these studies found no statistically significant correlation between spending and achievement.[2]
A few more recent studies do deviate from this general finding, however. One study, for instance, found that court-ordered funding increases of the 1970s and ‘80s led to long-term measurable improvements in life outcomes for students.[3] This research suggests that it may be possible to boost student achievement through spending more on certain types of schools, but it has limitations.[*] For instance, it finds statistically meaningful positive outcomes for some students only after they were exposed to a 10 percent increase in spending every year for 12 consecutive years of schooling.
There are similar findings from studies of Michigan’s drastic change to school funding just over 20 years ago. In 1994, Michigan voters passed Proposal A, which overhauled the state’s school finance system and created new per-pupil funding guarantees to school districts. Since a large number of districts were set to receive a substantial increase in funding, this created a natural experiment through which researchers could measure the effects of significant changes in per-pupil spending.[†]
Two studies of Proposal A’s impact on student outcomes suggest that increased spending by previously low-funded districts resulted in statistically significant positive gains in test scores.[‡] One of the studies found that the increased funding boosted the pass rates for both fourth- and seventh-grade math, but only by a small amount: A 10 percent increase in spending was correlated with less than a one percentage point increase in pass rates.[§] A later study of roughly the same period found a similar result, but only for previously low-spending school districts and only for fourth- and seventh-grade achievement.[4]
These two studies have limited relevance to the current debates about school funding in Michigan, however. It’s unlikely that public schools would again receive large increases in funding like the ones these studies analyzed; current policy debates about school resources only concern marginal changes to school funding levels. Additionally, their findings show the most positive gains for relatively low-spending schools and little or no gains for relatively high-spending schools. Per-pupil funding has increased in real terms since the time period examined by these studies, and most Michigan schools today would be high-spending ones if compared to the schools these studies analyzed.[5]
As of now, the preponderance of evidence supports Hanushek’s findings, which are probably the most relevant ones for Michigan policymakers who face decisions about school funding. Hanushek summarizes their significance as follows:
The studies, of course, do not indicate that resources never make a difference. Nor do they indicate that resources could not make a difference. Instead they demonstrate that one cannot expect to see much if any improvement simply by adding resources to the current schools.[6]
[*] For one critique of this study’s methodology and the meaningfulness of its findings, see: Jay P. Greene, “Does School Spending Matter After All?” (Jay P. Green’s Blog, May 29, 2015), https://perma.cc/F3XS-99W4.
[†] For more information about Proposal A, see: Patrick L. Anderson, “Proposal A: An Analysis of the June 2, 1993, Statewide Ballot Question” (Mackinac Center for Public Policy, May 1, 1993), https://perma.cc/9BB5-6MFB.
[‡] In additional to these published studies, there is a working paper that finds positive long-run effects of large increases to school funding as a result of Proposal A. Specifically, the research finds that students who were exposed to a 12 percent increase in per-pupil funding each year (or about $1,000 per student) from grades four through seven had a 3.9 percentage point higher college enrollment rate and a 2.5 percentage point higher college graduation rate. Joshua Hyman, “Does Money Matter in the Long Run? Effects of School Spending on Educational Attainment,” Sept. 15, 2014, https://perma.cc/73X6-UUC7.
[§] Leslie E. Papke, “The Effects of Spending on Test Pass Rates: Evidence from Michigan,” Journal of Public Economics 89, no. 5–6 (June 2005): 821–839, https://perma.cc/F3Q2-RA92. Papke later revised these estimates and found that “[g]iven a 10% increase in four-year averaged spending, the estimated average effect on the pass rate varies from about three to six percentage points.” Leslie E. Papke and Jeffrey M. Wooldridge, “Panel Data Methods for Fractional Response Variables with an Application to Test Pass Rates,” Journal of Econometrics 145, no. 1–2 (2008): 121–133, https://perma.cc/H57Z-JW7V.
In December 2014 the Michigan Legislature approved a formal “comprehensive statewide cost study,” also referred to as an “adequacy study,” as part of a deal to win bipartisan support for a transportation funding ballot measure.[7] Shortly after Proposal 1 of 2015 failed handily at the ballot box, the study was included in the Legislature’s formally adopted 2015-16 budget.[8] Denver-based Augenblick, Palaich & Associates secured the contract bid for $399,000.[9] Within 30 days of the March 31, 2016, deadline called out in law, the Michigan Department of Technology, Management and Budget must submit the findings to the governor and to the Legislature.[10] The original statutory deadline was not met, but the department granted APA an extension to complete its work by May 13, 2016.[11]
APA describes the project as an examination of “the revenues and expenditures of successful districts in the state, the equity of the state’s finance system, and the cost differences for non-instructional expenditures.”[12] In the 1990s the original cofounders of APA pioneered the “successful school district” approach, one of the two most common methods used to formulate the estimates for funding recommendations in similar studies.[13] The other, known as the “professional judgment” approach, derives its estimates by asking panels of school district officials what resources they need to reach successful rates of academic achievement or other systemwide performance goals.[14]
School funding adequacy studies are not new: There were 39 such studies performed in 24 different states between 2003 and 2014. Of these, 38 concluded that additional tax dollars were needed to meet the designated standard of adequacy. APA conducted 13 of these 39 studies, recommending a funding increase every time.[15]
In 2005 APA used the professional judgment method to assess Connecticut’s school finance system, which at the time ranked fourth nationally in per-pupil revenue.[16] Its recommendation called for a 35 percent increase to make the Nutmeg State’s K-12 funding “adequate.”[17] Public schools in the District of Columbia receive more money on average per pupil than any other jurisdiction in the nation (over $29,000 per student), and APA also recommended that its funding be increased by 22 percent.[18]
APA’s standard approaches have been extensively criticized. James Guthrie and Matthew Springer assessed eight APA studies using the professional judgment method. They found dramatically different prescriptions across APA’s studies for the number of “instructional personnel” needed to serve each 1,000 students, a core factor in attempts to estimate the cost of providing an adequate education. Maryland experts claimed to need 116 instructors per 1,000 students; Indiana experts said 63 would do the trick. Guthrie and Springer said the disparity would “suggest, at a minimum, that there is no science involved in such estimations.”[19]
Hanushek similarly has demonstrated a wide variation in the spending levels of “successful school districts,” casting doubt on the appropriateness of one of the more common approaches used in estimating adequate school funding levels. The fact that schools and districts can achieve similar results while differing in how much they spend suggests that adequate levels of funding can vary district by district or school by school. According to Hanushek, “[T]here is no evidence to suggest that the methodology used in any of the existing costing-out approaches … is capable of answering” how much overall funding is needed to attain specific levels of performance.[20]
A macro view of student performance and education spending in Michigan over the last decade suggests a weak relationship between these two variables. Education Week’s 2016 analysis of achievement trends on the National Assessment of Educational Progress — referred to as “the nation’s report card” — found only one state that lowered its overall math and reading proficiency rates between 2003 and 2015: Michigan. The retrograde movement landed the Great Lakes State at 43rd in K-12 achievement.[21] These results are not entirely explained by poverty or a few bad school systems: Michigan’s middle- and upper-income students made less progress from 2003 to 2015 in reading and math on the NAEP tests than their less-affluent peers, on average.[22]
Over that same period, despite a severe economic recession, the most current data available (2012-13) show Michigan’s per-pupil spending grew by 11 percent in real terms. Adjusted for regional cost differences, Michigan spent $8,646 per pupil in 2002-03. A full decade later, according to Education Week, the state’s average per-pupil expenditures reached $12,188.[23]
From a large-scale perspective, the data suggest that there isn’t much of a relationship between how much taxpayers dedicate to public schools on a per-pupil basis and how well students perform on standardized tests. It still could be the case, though, that at an individual building level, more resources could help improve student achievement. The regression analysis used for this study analyzes the spending and achievement of individual public schools throughout Michigan over a period of seven years.
The data used in this study come from the Michigan Department of Education and include building-level information, such as detailed financial records, student demographics, test scores and graduation rates. A series of regression analyses was performed to identify statistically significant relationships between spending inputs and academic outputs from more than 4,000 Michigan public schools.
Spending Inputs
Detailed information for fiscal years 2004 through 2013 came from the Michigan Department of Education. For each assigned school building code, yearly expenditures were disaggregated both by different objects and different functions according to the state’s standard chart of accounts. An aggregated building-level spending amount for each building was included as a primary independent variable in the analysis.
Academic Outputs
The dependent variables in the building-level regression encompass a comprehensive range of measurable academic outcomes. These include elementary and middle school (grade three through eight) test scores from 2008 to 2013 in math, reading and science on the Michigan Educational Assessment Program tests and high school test scores from the Michigan Merit Examination subject tests over the same seven years, as well as composite and individual subject scores from ACT tests administered to the state’s 11th graders from 2007 to 2013.[*] Scale scores from each of the tests are measured as dependent variables. Also included as outputs were on-time (four-year) and extended (five-year and six-year) graduation rates.
In all there are 28 academic indicators, which are listed in Graphic 1 below.
Graphic 1
|
Academic Indicator |
Number of Indicators |
|
MEAP Math Scores |
6 |
|
MEAP Reading Scores |
6 |
|
MEAP Science Scores |
2 |
|
MME Subject Test Scores |
5 |
|
ACT Composite and Subject Test Scores |
6 |
|
Graduation Rates |
3 |
School and Student Characteristics
Detailed information for fiscal years 2004 through 2013 came from the Michigan Department of Education. For each assigned school building code, yearly expenditures were disaggregated both by different objects and different functions according to the state’s standard chart of accounts. An aggregated building-level spending amount for each building was included as a primary independent variable in the analysis.[†]
[*] MEAP science tests were only administered to fifth- and eighth-grade students.
[†] Building-level enrollments also were broken down by recognized racial categories, English language acquisition and disability status from 2010 to 2014. This relatively smaller data sample was excluded from the regression analysis reported. Separate regressions were run to include the racial categories, but there was no qualitative or quantitative change to the overall findings.
Averaged across the general student population, there was no statistically significant correlation between a school’s spending levels and its students’ academic performance in 27 of the 28 academic indicators used in the model. In the only category that did show a statistically significant correlation — seventh-grade math — the impact of spending more was very small. The model shows that a school would need to spend 10 percent more to improve its average seventh-grade math scale score by just .0574 points.
The table below lists the findings by each academic indicator. The figures represent the increase in a scale score or graduation rate that could be expected with a 10 percent increase in per-pupil spending. As is customary when reporting these types of results, an asterisk next to a figure indicates that the finding is statistically significant, meaning there is better than a 90 percent chance that the finding is different from zero. On the other hand, a number with no asterisk means that the finding is not statistically robust (not different from zero). This was the case for 27 of the 28 academic indicators.
Graphic 2: Increase per 10 Percent Per-Pupil Spending Increase, 2007-2013
|
Academic Indicator |
Increase Per 10% Spending Increase |
|
3rd Grade Math |
0.1297 |
|
4th Grade Math |
0.0505 |
|
5th Grade Math |
0.2514 |
|
6th Grade Math |
-0.0714 |
|
7th Grade Math |
0.0574* |
|
8th Grade Math |
0.0243 |
|
3rd Grade Reading |
0.0894 |
|
4th Grade Reading |
0.0035 |
|
5th Grade Reading |
0.1419 |
|
6th Grade Reading |
0.0514 |
|
7th Grade Reading |
0.0386 |
|
8th Grade Reading |
-0.0249 |
|
5th Grade Science |
0.2013 |
|
8th Grade Science |
-0.0143 |
|
ACT Composite |
0.0003 |
|
ACT English |
0.0009 |
|
ACT Math |
0.0008 |
|
ACT Reading |
-0.0049 |
|
ACT Science |
0.0031 |
|
ACT Writing |
0.0064 |
|
MME Math |
0.0460 |
|
MME Reading |
-0.0535 |
|
MME Science |
0.0304 |
|
MME Social Studies |
0.0559 |
|
MME Writing |
0.0259 |
|
Four-year Graduation Rate |
0.0580 |
|
Five-year Graduation Rate |
0.0042 |
|
Six-year Graduation Rate |
0.0494 |
The results of this analysis suggest that there is no statistically meaningful correlation between how much individual public schools in Michigan spend and how well their students perform on standardized tests. In the one area where there was a measurable and statistically significant correlation, the size of the impact of additional spending was very small. This implies that simply spending more on public schools is not likely to produce improvements to student achievement.
This type of result might surprise some, considering that when schools spend more, they can hire more teachers and devote more resources to instruction. But it could also be the case that public schools, on average, fail to spend additional resources in ways that measurably improve student achievement.
For instance, the University of Washington’s Center for Reinventing Public Education conducted a six-year study to assess the nation’s various school finance systems. They concluded that school finance systems are constructed more around the needs of adults than students and are designed to foster compliance rather than results. Further, the research team observed that these systems are not equipped to provide the detailed information that would show which uses of funds are more productive than others. In other words, public schools may not even have the information they would need to know how to most effectively spend more money in order to boost student achievement.[24]
Eric Hanushek has argued that unless the incentive structure changes in K-12 schools, increasing the funding of public schools is unlikely to be an effective strategy to improving student performance. He analyzed the ways in which school systems have used extra money: to reward teachers for gaining more experience or obtaining more advanced degrees, to increase the number of teachers as a means of reducing class sizes, and to hire more noninstructional staff for various support and administrative purposes. Statistical analyses have not found that increased spending generally increases student outcomes, at least as measured on standardized tests.[25]
Again, none of this is to say that resources never or cannot matter when it comes to improving student achievement. However, the bulk of the research on this question suggests that given the way public schools currently spend their resources, it is unlikely that just adding extra resources to the equation, all else being equal, will generate meaningful improvements to student performance.
This study uses a large and unique data set of building-level spending, achievement and student demographical information to test whether there is a correlation between how much schools in Michigan spend and how well their students perform on standardized tests and how likely they are to graduate from high school. The results suggest that there is only a very limited correlation between these two factors. Only one out of the 28 academic outputs analyzed showed a result that was positive and statistically significant, or different from zero.
This is not to say, however, that resources never matter in providing a quality educational experience. They certainly do — but probably only up to a certain point. As research has suggested, this may be because Michigan’s public education system is not designed for the most productive use of resources, at least when it comes to improving standardized test scores and graduation rates. A lack of competitive incentives or of meaningful repercussions for poor performance may contribute to this. It could also be that the way resources are distributed and the way spending is prescribed by overlapping local, state and federal governing bodies interferes with individual schools’ ability to use money in the most efficient and effective ways.
Based on these results, it is unlikely that injecting new resources into Michigan’s public school system, all else remaining equal, will make a meaningful difference in improving student achievement.
The empirical results reported in this study are obtained by estimating the following baseline regression equation using school-level panel data that varies by school and time:
(Education Outcomes)sy= β0+β1 ln?(spending per pupil)sy +β2 (% free or reduced lunch)sy+β3 ln(grade enrollment)sy + γs+αy+εsy.
The variables are denoted with school and time subscripts indicating that a particular variable is for school s in year y. The main predictor variable of academic outcomes is constructed as the natural logarithm of annual school-level total spending divided by annual school-level total student enrollment. The purpose of transforming spending per pupil into natural logarithms is to make the relationship between academic outcomes and spending per pupil linear, since it is possible that the statistical relationship between these two variables is nonlinear. In addition, academic outcomes are further modeled as functions of the percentage of students eligible for a free or reduced-price lunch and the number of students enrolled in a specific grade level.
Different measures of education outcomes represent the dependent variables in the equation. These outcomes are measures of performances of for all students who took the MEAP subject tests for grades three through eight, MME and ACT subject tests in grade 11 and the high school graduation rates of all students.
β0 is the constant term, εsy is the error term, αy is a year effect and γs is a school fixed effect. These fixed-effects terms are included in the regression equation to account for the effects of predictor variables on academic outcomes that are omitted in the regression equation. For example, measures of school quality and economic conditions for the state of Michigan are not included in the regression equation, but they have an impact on academic outcomes and so are accounted for via the fixed-effect terms. The fixed-effects terms remove both the school-specific means and year-specific means from the variables in the equation.
Finally, the equation is estimated considering that the schools are grouped into districts. If the error terms for different schools within a given district are correlated, then this could lead to relatively small standard errors being estimated and, therefore, misleading statistical inferences. Therefore, to control for this statistical issue, the estimated standard errors in the regression equation are clustered at the district level.
As is standard in reporting statistical results, a figure with one asterisk signifies statistical significance at a 90 percent level of confidence, two asterisks at a 95 percent level of confidence and three asterisks at a 99 percent level of confidence.
| Academic Indicator | Grade | |||||||
| MEAP: Math | 3 | 4 | 5 | 6 | 7 | 8 | ||
| Coefficient Estimate | ||||||||
| Spending per pupil | 1.297 | 0.505 | 2.514 | -0.714 | 0.574* | 0.243 | ||
| -0.908 | -1.596 | -1.739 | -0.447 | -0.346 | -0.432 | |||
| Pct FRL | 4.962 | 7.11 | 5.338 | -1.841 | -1.925** | -1.892** | ||
| -4.383 | -6.416 | -4.935 | -1.537 | -0.912 | -0.882 | |||
| Grade enrollment | -8.949*** | -1.696 | -14.89*** | -10.14*** | -13.00*** | -9.504*** | ||
| -2.128 | -5.23 | -3.022 | -2.515 | -2.499 | -2.465 | |||
| Additional Information | ||||||||
| N | 6,626 | 6,434 | 5,327 | 1,896 | 2,274 | 2,256 | ||
| Adjusted R-squared | 0.89 | 0.91 | 0.884 | 0.889 | 0.908 | 0.908 | ||
| Grade | ||||||||
| MEAP: Reading | 3 | 4 | 5 | 6 | 7 | 8 | ||
| Coefficient Estimate | ||||||||
| Spending per pupil | 0.894 | 0.035 | 1.419 | 0.514 | 0.386 | -0.249 | ||
| -0.952 | -1.638 | -1.324 | -0.4 | -0.513 | -0.381 | |||
| Pct FRL | 6.758 | 6.832 | 6.471 | -0.924 | -2.799** | -1.972** | ||
| -4.733 | -6.586 | -4.881 | -1.349 | -1.403 | -0.775 | |||
| Grade enrollment | -8.747*** | -2.336 | -9.735*** | -6.001*** | -12.06*** | -6.674*** | ||
| -2.196 | -5.11 | -2.564 | -1.848 | -2.776 | -1.926 | |||
| Additional Information | ||||||||
| N | 6,628 | 6,435 | 5,328 | 1,896 | 2,274 | 2,256 | ||
| Adjusted R-squared | 0.892 | 0.907 | 0.883 | 0.892 | 0.865 | 0.896 | ||
| Grade | ||||
| MEAP: Science | 5 | 8 | ||
| Coefficient Estimate | ||||
| Spending per pupil | 2.013 | -0.143 | ||
| -1.43 | -0.511 | |||
| Pct FRL | 4.486 | -2.614*** | ||
| -4.394 | -0.829 | |||
| Grade enrollment | -13.46*** | -8.318*** | ||
| -2.904 | -2.207 | |||
| Additional Information | ||||
| N | 5,327 | 2,256 | ||
| Adjusted R-squared | 0.9 | 0.909 | ||
| Subject | ||||||
| MME | Math | Reading | Science | Social Studies | Writing | |
| Coefficient Estimate | ||||||
| Spending per pupil | 0.46 | -0.535 | 0.304 | 0.559 | 0.259 | |
| -1.221 | -0.876 | -1.111 | -0.501 | -1.131 | ||
| Pct FRL | -1.323 | -1.966* | -1.386 | 0.213 | -1.425 | |
| -1.165 | -1.179 | -1.189 | -0.622 | -1.343 | ||
| Grade enrollment | -11.05*** | -4.274* | -7.020** | -2.139 | -3.943 | |
| -2.237 | -2.501 | -2.784 | -1.733 | -2.792 | ||
| Additional Information | ||||||
| N | 3,096 | 3,102 | 3,101 | 3,101 | 3,108 | |
| Adjusted R-squared | 0.919 | 0.908 | 0.923 | 0.928 | 0.912 | |
| Test | |||||||
| ACT | Composite | English | Math | Reading | Science | Writing | |
| Coefficient Estimate | |||||||
| Spending per pupil | 0.0027 | 0.0091 | 0.0084 | -0.049 | 0.031 | 0.064 | |
| -0.074 | -0.102 | -0.074 | -0.1 | -0.081 | -0.041 | ||
| Pct FRL | -0.105 | -0.117 | -0.041 | -0.029 | -0.170* | -0.092 | |
| -0.095 | -0.126 | -0.076 | -0.124 | -0.102 | -0.084 | ||
| Grade enrollment | -0.711*** | -0.804*** | -0.814*** | -0.748*** | -0.482* | -0.221 | |
| -0.215 | -0.282 | -0.162 | -0.274 | -0.254 | -0.186 | ||
| Additional Information | |||||||
| N | 3,562 | 3,562 | 3,562 | 3,562 | 3,562 | 2,557 | |
| Adjusted R-squared | 0.952 | 0.935 | 0.952 | 0.931 | 0.937 | 0.865 | |
| Graduation Rate | 4-year | 5-year | 6-year | |
| Coefficient Estimate | ||||
| Spending per pupil | 0.58 | 0.042 | 0.494 | |
| -0.7 | -0.687 | -0.758 | ||
| Pct FRL | 1.627 | 1.493 | 0.938 | |
| -0.988 | -1.103 | -1.288 | ||
| Grade enrollment | -9.997** | -3.09 | 3.251 | |
| -3.924 | -2.751 | -3.53 | ||
| Additional Information | ||||
| N | 3,880 | 3,364 | 2,802 | |
| Adjusted R-squared | 0.909 | 0.925 | 0.917 | |
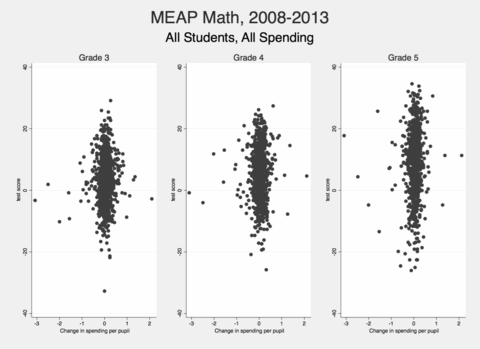
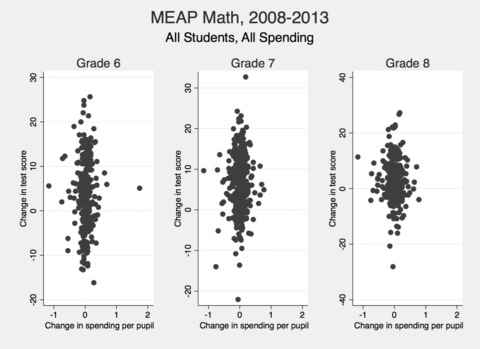
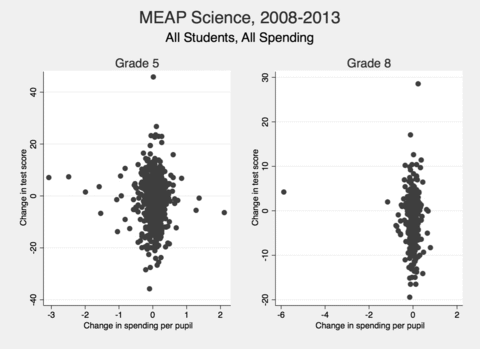
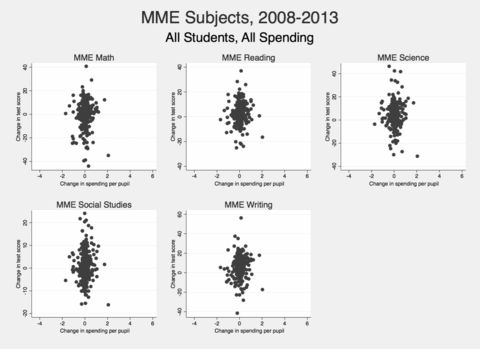
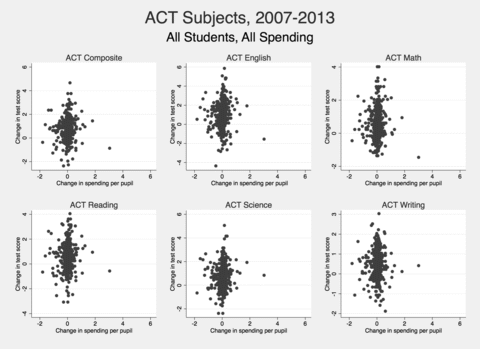
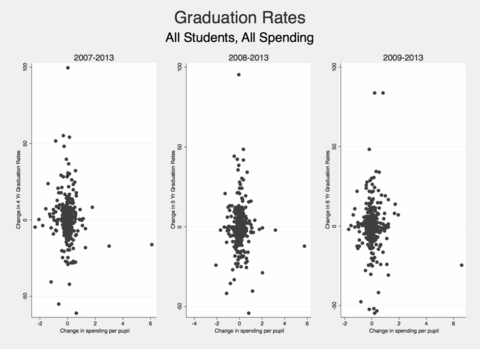
The graphics below include scatterplots of regression results. The x-axis displays a school’s change in per-pupil spending and the y-axis shows a school’s change in average scale scores. If school spending were positively correlated in a statistically significant way to student achievement, the blots on these graphs would appear to follow a line slopping upwards from the bottom left to the upper right. The results, however, show much more vertical lines, suggesting that the amount of money that schools spend have little correlation to how well students perform.
Graphic 4: MEAP Reading Test Results, Grades 3-5, 2008-2013
Graphic 5: MEAP Reading Test Results, Grades 6-8, 2008-2013
Graphic 6: MEAP Math Test Results, Grades 3-5, 2008-2013
Graphic 7: MEAP Math Test Results, Grades 6-8, 2008-2013
Graphic 8: MEAP Science Test Results, Grades 5 and 8, 2008-2013
Graphic 9: MME Test Results by Subject, 11th Grade, 2008-2013
Graphic 10: ACT Test Results by Subject, 11th Grade, 2007-2013
Graphic 11: Graduation Rates, 2007-2013
1 Eric A. Hanushek, “Assessing the Effects of School Resources on Student Performance: An Update,” Educational Evaluation and Policy Analysis 19 (1997): 144, https://perma.cc/8KX8-YSVJ.
2 Ibid., 145.
3 C. Kirabo Jackson, Rucker C. Johnson and Claudia Persico, “The Effects of School Spending on Educational and Economic Outcomes: Evidence from School Finance Reforms,” The Quarterly Review of Economics (2016): 157, https://perma.cc/BW56-L9C9.
4 Joydeep Roy, “Impact of School Finance Reform on Resource Equalization and Academic Performance: Evidence from Michigan,” Education Finance and Policy 6, no. 2 (2011): 137–167, https://perma.cc/FL4K-38RU.
5 Jack Spencer, “Michigan Schools Receive Over $12,500 Per Student,” Michigan Capitol Confidential (Mackinac Center for Public Policy, Aug. 11, 2015), https://perma.cc/V6R2-L4LM.
6 Eric A Hanushek, “Spending on Schools,” in A Primer on American Education, ed. Terry Moe (Stanford, CA: Hoover Institution Press, 2001), 81–82, https://perma.cc/3YHR-MYJS.
7 MCL § 380.1281a(2); Monica Scott, “West Michigan Lawmaker Says Comments Education Cost Study Can Reframe Funding Debate” (MLive.com, Jan. 2, 2015), https://perma.cc/5MF3-MJTG.
8 “Funding For School Costs Study Included In Budget,” MIRS Capital Capsule (Michigan Information & Research Service Inc., June 9, 2015), http://goo.gl/pzIFkt.
9 “Ed Cost Study Contract OKed Despite Reps’ Protest,” MIRS Capital Capsule (Michigan Information & Research Service Inc., Sept. 30, 2015), http://goo.gl/zzswlO.
10 MCL § 380.1281a(3).
11 “Ed Funding Adequacy Study Now Expected In Mid-May,” MIRS Capital Capsule (Michigan Information & Research Service Inc., March 28, 2016), http://goo.gl/kdvJrk.
12 “Michigan Education Finance Study” (Augenblick, Palaich & Associates, 2016), https://perma.cc/UW7P-XSQL.
13 “School Finance” (Augenblick, Palaich & Associates, 2016), https://perma.cc/P75K-LH2K.
14 Anabel Aportela et al., “A Comprehensive Review of State Adequacy Studies Since 2003” (Augenblick, Palaich & Associates, Sept. 14, 2014), 9–11, https://perma.cc/Z2X8-2PUN.
15 Ibid., iv, 15.
16 “Public Education Finances: 2005” (U.S. Census Bureau, 2007), xii, https://perma.cc/BQG7-E4M7.
17 John Augenblick et al., “Estimating the Cost of an Adequate Education in Connecticut Prepared By” (Augenblick, Palaich & Associates, June 2005), 78, https://perma.cc/4MK4-NURJ.
18 “Public Education Finances: 2013” (U.S. Census Bureau, June 2015), 11, https://perma.cc/M5GE-SVEJ; Cheryl D. Hayes et al., “Cost of Student Achievement: Report of the DC Education Adequacy Study” (Augenblick, Palaich & Associates, Dec. 20, 2013), 111, https://perma.cc/AG93-6JTH.
19 James W. Guthrie and Matthew G. Springer, “Alchemy: Adequacy Advocates Turn Guesstimates Into Gold,” Education Next (2007): 24–25, https://perma.cc/HQF8-RBT7.
20 Eric A. Hanushek, “Pseudo-Science and a Sound Basic Education,” Education Next (2005): 71–72, https://perma.cc/9KA6-QZA5.
21 “Quality Counts 2016: K-12 Achievement” (Education Week, Dec. 30, 2015), https://perma.cc/69FF-VS5J.
22 Author’s calculations based on NAEP Data Explorer, http://goo.gl/Z3t7sM.
23 “Quality Counts 2006, Resources: Spending” (Education Week, 2006), https://perma.cc/JK7D-E9JQ; “Quality Counts 2016: Michigan State Highlights” (Education Week, Jan. 26, 2016), https://perma.cc/FAC7-NMXV.
24 Paul T. Hill, Marguerite Roza and James Harvey, “Facing the Future: Financing Productive Schools” (Center on Reinventing Public Education, Dec. 2008), 32–35, https://perma.cc/YCM4-CG4K.
25 Eric A Hanushek, “School Resources,” in Handbook of the Economics of Education, ed. Eric A. Hanushek and Finis Welch, vol. 2 (Elsevier B.V., 2006), 889–890, https://perma.cc/7FWX-7LC5.