The right to decide for yourself whether or not to support a union in your workplace: union officials dismiss it as "the right to starve", but for the last thirty years Right-to-Work states have been outperforming compuslory unionism states such as Michigan. This report demonstrates how individual freedom and higher productivity give workers in Right-to-Work states the edge in job opportunities, employment, and purchasing power.
"Right-to-work" (RTW) laws are state statutes or constitutional provisions
that ban the practice of requiring union membership or financial support as a
condition of employment. These laws establish the legal right of employees to
decide for themselves whether or not to join or financially support a union. The
right to enact a RTW law is assured by Section 14(b) of the Federal
Labor-Management Relations Act (also called the Taft-Hartley Act) of 1947.
Since the 1940s, 22 states have adopted RTW laws, the most recent being
Oklahoma, which added a provision to its constitution in 2001. Michigan, a non-RTW
state, is home to 972,000 unionized employees, which represents 21.8 percent of
all private and public sector workers employed in Michigan in 2001.
Advocates of RTW laws cite a growing body of evidence showing that RTW states
enjoy faster economic and employment growth than non-RTW states. This growth
advantage-experienced predominantly by the southern and western states, which
comprise the bulk of RTW states-has been in evidence ever since Taft-Hartley was
passed.
Opponents of right-to-work laws argue, conversely, that compulsory unionism is
necessary to offset the power of big business in a market economy. In this view,
big business and free markets are responsible for a slowdown in real earnings
for workers and for greater income inequality during the past quarter century.
To evaluate the merits of these arguments, this study compares economic
development between RTW and non-RTW states. It examines a broad cross-section of
state economic statistics from the past three decades. Michigan's economic
performance receives particular attention. The results of this analysis
contradict many of organized labor's long-standing contentions.
The following are the key conclusions of the research. Except where otherwise
noted, these data are averages of annual figures taken from 1970 through 2000:
From 1977 through 1999, Gross State Product (GSP), the market value of all goods and services produced in a state, increased 0.5 percent faster in RTW states than in non-RTW states. Michigan's GSP grew at roughly half the rate of RTW states.
Employment grew almost 1 percent faster each year, on average, in RTW states. Employment in Michigan grew only half as fast as employment in RTW states.
Manufacturing employment grew 1.7 percent faster in RTW states. Right-to-work states created 1.43 million manufacturing jobs, while non-RTW states lost 2.18 million manufacturing jobs. Michigan lost more than 100,000 manufacturing jobs during this period, performing even worse than many other non-RTW states.
Construction employment grew 1 percent faster each year, on average, in RTW states. Michigan ranked 32nd in the nation in this category.
From 1978 through 2000, average annual unemployment was 0.5 percent lower in RTW states. Unemployment in Michigan was 2.3 percent higher than in RTW states.
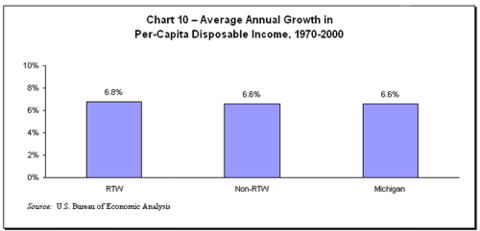
Per-capita disposable income was 0.2 percent higher, on average, in RTW states. Michigan's rate of increase in this category matched the average for other non-RTW states. Although nominal per-capita disposable income was 10 percent higher in non-RTW states in 2000, research shows that the cost of living is also higher in these states; so high, in fact, that after-tax purchasing power-real income-is greater in RTW states.
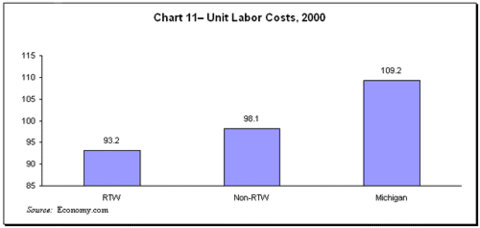
Unit labor costs-the measure of labor compensation relative to labor productivity-were 93.2 in RTW states and 98.1 in non-RTW states in 2000. Michigan, at 109.2, had the second highest unit labor costs in the nation that same year, exceeding all but New Jersey.
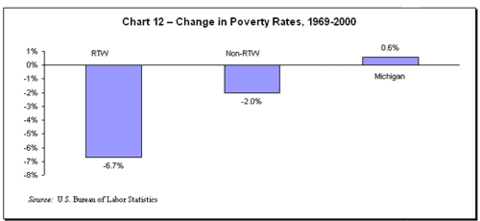
The percentage of families living in poverty in RTW states dropped from 18.3 percent to 11.6 percent between 1969 and 2000. During this same period, seven states saw increases in poverty, all non-RTW states. Michigan was among them, with a poverty increase of 0.6 percent, ranking it 45th among the states in poverty rate improvement.
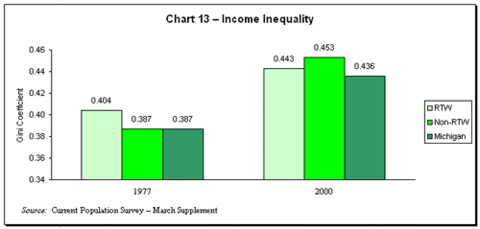
Income inequality rose in both RTW and non-RTW states between 1977 and 2000. But while this inequality was greater in RTW states in 1977, by 2000 the situation had reversed.
This study attributes the better economic performance of RTW states to
greater labor productivity. The post-World War II period has brought rapid
economic globalization, which has dramatically increased the importance of labor
productivity and of policies, such as right-to-work, that affect it.
Advances in information technology, greater capital mobility, and lower barriers
to entry for business startups are making it increasingly difficult for
businesses to pass higher costs on to suppliers and customers. The net effect is
increasing pressure for firms to seek geographical regions with lower cost
structures and higher rates of labor productivity.
Right-to-work laws increase labor productivity by requiring labor unions to earn
the support of each worker, since workers are able to decide for themselves
whether or not to pay dues. This greater accountability results in unions that
are more responsive to their members and more reasonable in their wage and work
rule demands.
The study predicts that Michigan will continue to fall behind economically
relative to RTW states until it adopts a right-to-work policy.
In September of 2001, the citizens of Oklahoma overcame powerful union
opposition to approve a "right-to-work" provision for their state constitution.
"Right-to-work" laws are state statutes or constitutional provisions that ban
the practice of requiring union membership or financial support as a condition
of employment. This successful campaign made Oklahoma the 22nd state to achieve
right-to-work (RTW) status since this option was assured under the Taft-Hartley
amendments to the National Labor Relations Act in 1947.
The Oklahoma story is only the latest evidence of a growing interest in
reassessing the costs and benefits of the compulsory union regime spawned during
the Great Depression, and which remains today one of the primary determinants of
labor productivity. With increasing global competitiveness taking a toll on U.S.
manufacturing jobs, and state governments and municipalities struggling to
achieve greater operating efficiencies in the face of declining revenues and
increasing costs, the consequences of compulsory unionism are universally
important.
Today labor union membership is at its lowest point since the 1950s. Eighty-four
percent of Michigan's private sector workers (and 91 percent nationwide) pay no
dues to any union; they either work for themselves or negotiate individually
with employers, and manage for the most part to do rather well. In Michigan's
manufacturing sector, however, which is a critical component of our economic
vitality, 29.2 percent or 305,900 manufacturing employees are represented by
unions. In addition, Michigan is home to 350,000 unionized state and local
government employees, constituting 56.2 percent of the public sector workforce.
Total union membership stands today at 972,000, or 21.8 percent of all workers
employed in Michigan during 2001.
Advocates of right-to-work laws point toward a growing body of evidence showing
faster economic and employment growth in right-to-work states. This growth
advantage-experienced predominantly by the southern and western states, which
comprise the bulk of right-to-work states-has been in evidence since the passage
of the Taft-Hartley Act in 1947.
Opponents of right-to-work laws, conversely, maintain that compulsory union
support is vital to organized labor, which protects workers from the negative
aspects of big business and market economies. In this view, firms seeking to
maximize profits at the expense of rank-and-file workers are responsible for the
slowdown in real earnings and the growing income inequality over the past
quarter century.
To evaluate the merits of these arguments, this study compares economic
development between RTW states and non-RTW states by examining a broad cross
section of economic statistics from the past three decades. The results of this
analysis challenge many of organized labor's long-standing contentions.
Particular attention is paid to Michigan's economic performance.
Section II provides an overview of compulsory unionism and RTW statutes as
background for the economic analysis that follows. Section III provides a brief
review of the literature on the impact of RTW laws. Section IV gives a
geographical breakdown between RTW and non-RTW states. Section V discusses how
globalization is impacting union activity. Section VI compares RTW and non-RTW
states using nine economic measurements. The final section summarizes the
results.
Some highlights from the economic analysis are summarized below:
From 1970 through 2000:
RTW states' economies grew one-half percent faster annually.
RTW states created 1.43 million manufacturing jobs; non-RTW states lost 2.18 million manufacturing jobs.
RTW states have greater disposable income growth.
RTW states have lower unit labor costs.
RTW states' poverty rates are falling faster.
Michigan's performance:
Annual economic growth averaged one-half the rate experienced by RTW states.
The state lost over 100,000 manufacturing jobs since 1970.
Annual construction employment growth was a full percent below that of RTW states.
The state had the second highest unit labor costs in the nation.
The poverty rate rose.
Right-to-work is a labor law term used to describe state laws or state constitutional provisions that ban any requirement of union membership or financial dues obligations as a condition of employment. Currently RTW laws exist in 22 states: Alabama, Arizona, Arkansas, Florida, Georgia, Idaho, Iowa, Kansas, Louisiana, Mississippi, Nebraska, Nevada, North Carolina, North Dakota, Oklahoma, South Carolina, South Dakota, Tennessee, Texas, Utah, Virginia, and Wyoming. A right-to-work law secures the right of employees to decide for themselves whether or not to join or financially support a union.
The opportunity to enact a right-to-work law is assured by Section 14(b) of the Federal Labor-Management Relations Act of 1947 (also called the Taft-Hartley Act). That section reads:
Nothing in this Act shall be construed as authorizing the execution or application of agreements requiring membership in a labor organization as a condition of employment in any State or Territory in which such execution or application is prohibited by State or Territorial law.
These 44 words are fighting words to labor union officials who charge that their
union security and solidarity is jeopardized by allowing individual workers to
opt out of any union membership or financial requirements. Right-to-work
proponents, however, argue that these laws uphold the civil right of Americans
to work without being forced to pay union membership dues or agency fees in
order to continue working.
In order to understand the role of economic analysis in the RTW debate, it is
important to understand the main arguments marshaled by both supporters and
opponents of RTW laws. The primary argument of opponents is that workers benefit
from union representation, and that therefore they should be required to pay the
cost of this representation. Unions argue that RTW laws create "free riders,"
employees who receive the benefits of a bargaining contract while escaping any
financial obligation to reimburse the union for the costs of collective
bargaining.
To assess the merits of this claim, however, one must understand the nature of
compulsory unionism as it relates to the rights and duties of workers covered by
a collective bargaining contract. Most important is the fact that federal law
grants unions "exclusive representation" privileges. This means that once a
union is "recognized" (i.e., voted in by a majority of employees) it has the
sole right to speak for the entire group of employees and negotiate on its
behalf. Individual employee negotiations are prohibited. This is true even when
individuals have neither voted for a union nor desire union representation. A
right-to-work law does not affect this union privilege.
Exclusive representation therefore provides unions with total legal control in
employee representation matters. Exclusivity not only makes it illegal for
workers to bargain on their own, but also prevents them from hiring another
union or agent to deal on their behalf with their employers. Exclusivity
normally prevents any redress of a worker's problem without the union being
present during an employer-worker meeting.
Supporters of RTW laws claim that because employees are prevented from selecting a competing representative during the union's period of exclusivity-that the union has in essence a monopoly on worker representation-the union is likely to be less accountable to its members. This means that the union may, with relative impunity, provide fewer services to employees or engage in political or social activities having nothing to do with workplace issues. Right-to-work advocates therefore argue that requiring unions to earn the voluntary support of workers is one way to assure that union policies reflect the interests of the represented workers.
One solution to the alleged "free-rider" problem would be to eliminate
exclusive representation and permit a union to represent only those employees
desiring its representation. If a worker did not join and pay dues, the union
would not be required to represent him, and the worker could negotiate his own
employment relationship with the employer. Labor union officials, however,
consistently refuse to support this alternative. They fought hard for their
federal exclusive representation privileges and jealously protect them. They
claim that exclusivity permits the union to wield the bargaining power necessary
to balance the interests of workers with the interests of management. Unions
rely on their status as the sole representative for all bargaining unit workers
to justify the payment of forced union dues.
Supporters of RTW laws also take issue with the assumption, implicit in
organized labor's "free rider" argument, that union representation benefits all
employees in the negotiating unit. Supporters state that workers are often
"captive passengers" rather than "free riders." They claim there is always a
group of highly skilled or ambitious workers whose ability to get ahead is
impeded by union contract restrictions such as rigid seniority clauses, which
prevent them from competing for advancement. Employees may also oppose union
obligations because of union discrimination, which can result from employees
objecting to forced financing of union political activities.
The other major argument used by opponents of RTW laws is that working in a
right-to-work state is "the right-to-work for less" or "the right-to-starve."
This is shorthand for the idea that enactment of a right-to-work law will weaken
the union's ability to protect workers from management exploitation, and
therefore reduce the economic gains of workers.
The remainder of this study examines this latter claim, and suggests what
economic impact a right-to-work law might have in Michigan. The analysis
concludes that RTW laws do not lead to a reduction in economic benefits for
workers in RTW states and would not do so in Michigan. In fact, there are signs
that RTW laws have produced significant benefits for workers in those states.
The debate surrounding RTW principles often centers on emotional rhetoric. This
analysis, however, provides empirical evidence that will help both supporters
and opponents of right-to-work to assess more accurately the impact of a
Michigan RTW law on Michigan workers and their families.
More than five decades of experience with RTW laws has yielded a large body of economic analysis of their impact on a variety of economic factors.
Right-to-work laws were enacted, in large part, to promote economic growth.
Anecdotal evidence suggests that they have. The economies of RTW states have
been growing faster than those of non-RTW states since the late 1940s. Much
research attributes this phenomenon to employers seeking to avoid unions. (Cobb,
1982; Newman, 1983; 1984; Cappelli and Chalykoff, 1985; Kochan et al., 1986;
Reder, 1988). For a review of the pre-1980s literature see Moore (1985).
Survey research also indicates that RTW laws are important in industry location
decisions (for a review of the literature see Cobb, 1982 and Calzonetti and
Walker, 1991). Businesses often cite RTW laws or "favorable business climate" as
major factors in location decisions. For example, Schmenner (1982) reports that
in his survey of Fortune 500 firms a "favorable labor climate" was the most
important factor in industry location followed by proximity to markets.
Holmes (1996) finds a precipitous drop in manufacturing activity when crossing
the border from a RTW into a non-RTW state. Relative manufacturing employment
declines by one-third as one moves from within 25 miles of the border in the RTW
state to within 25 miles of the border in the non-RTW state. Holmes finds that
this pattern did not become statistically significant until the early 1960s or
many years after the passage of the Taft-Hartley Act (which permits RTW laws),
suggesting that it may take years for these laws to yield significant returns in
industrial development.
Examining 311 U.S. metropolitan areas, James Bennett (1994) finds that while
families living in non-RTW states have higher average nominal incomes, the
average urban family in a RTW state has $2,852 more in after-tax purchasing
power per year than the same family would have in a non-RTW state. This is
because on average, residents in states without RTW laws pay 24.5 percent more
for food, housing, health care, utilities, property taxes, and college tuition
than those in RTW states). Moreover, Bennett finds evidence that the gap in
living standards between RTW and non-RTW states appears to be growing over time.
Employing similar methodology for nine Midwestern states, David Kendrick (2001)
finds inflation-adjusted, after-tax income to be $1,145 higher in RTW states
(IA, KS, NE, ND) than in non-RTW states (IL, IN, MN, MO, WI).
Most RTW states adopted RTW laws during late 1940s and 1950s. Today such laws
are in effect in twenty-two states, most of them in the West and Southeast. The
Northeast is the only region without a RTW state while the South (at 12) has the
greatest concentration. Table 1 gives
the geographic breakdown of RTW states.
The rosters of RTW and non-RTW states have changed little in a half century.
After 19 states passed RTW legislation shortly after Taft-Hartley in 1947, only
three non-RTW states enacted a RTW law from 1964 until 2001. Oklahoma's passage
of a new law in 2001, however, shows that RTW legislation isn't entirely
dormant. Only one RTW state, Indiana, has repealed its law, in 1965.
State union membership rates are strongly correlated with RTW status. According to the U.S. Bureau of Labor Statistics, all states in the Great Lakes, Mid-Atlantic and Pacific regions (i.e., non-RTW regions) had union membership rates above the national average of 13.5 percent in 2001, while all states in the East South Central and West South Central divisions had below-average rates. Overall, 29 states had union membership rates below the U.S. average, while 21 states and the District of Columbia had higher rates.
Four states had union membership rates over 20 percent in 2001-New York,
Hawaii, Alaska, and Michigan (in order of decreasing share). Two states, North
and South Carolina, had membership rates below 5 percent. As of 2001, half of
the nation's 16.3 million union members lived in six states-California, New
York, Illinois, Michigan, Ohio, and Pennsylvania. These six states accounted for
35 percent of wage and salary employment nationally.
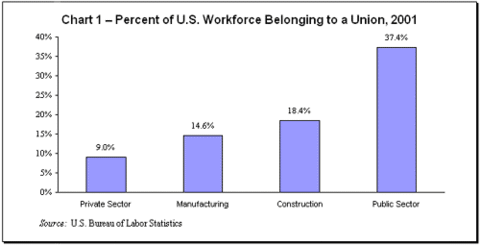
Workers in the public sector continued to have unionization rates that were
about four-times higher than their counterparts in private industry. In 2001,
the unionization rate of government workers was 37.4 percent, compared with 9
percent among private sector employees (see
Chart 1). Local government, which includes many workers in the heavily
unionized fields of public education (the NEA is the largest union in the
country), firefighting and law enforcement, had the highest unionization rate,
at 43.1 percent. The construction and manufacturing industries also had
higher-than-average unionization rates, at 18.4 percent and 14.6 percent,
respectively. The nonagricultural industry with the lowest unionization rate in
2001 was finance, insurance, and real estate at 2.1 percent.1
| Northeast | South | Midwest | West | Total | |
| Non-right-to-work | 11 | 2 | 7 | 8 | 28 |
| Right-to-work | 0 | 12 | 5 | 5 | 22 |
| Total | 11 | 14 | 12 | 13 | 50 |
| Northeast | South | Midwest | West |
| Connecticut | Alabama | Illinois | Alaska |
| Delaware | Arkansas | Indiana | Arizona |
| Maine | Florida | Iowa | California |
| Maryland | Georgia | Kansas | Colorado |
| Massachusetts | Kentucky | Michigan | Hawaii |
| New Hampshire | Louisiana | Minnesota | Idaho |
| New Jersey | Mississippi | Missouri | Montana |
| New York | North Carolina | Nebraska | Nevada |
| Pennsylvania | Oklahoma | North Dakota | New Mexico |
| Rhode Island | South Carolina | Ohio | Oregon |
| Vermont | Tennessee | South Dakota | Utah |
| Texas | Wisconsin | Washington | |
| Virginia | Wyoming | ||
| West Virginia |
NOTES: Right-to-work states denoted in bold. Indiana repealed its RTW law in 1965. Louisiana, Idaho, and Oklahoma passed RTW legislation in 1976, 1985, and 2001, respectively.
The post-World War II period has brought rapid economic globalization, which
has dramatically increased the importance of labor productivity and of policies,
such as right-to-work, that affect it. Advances in information technology,
greater capital mobility, and lower barriers to entry for business startups are
making it increasingly difficult for businesses to pass higher costs on to
suppliers and customers. The net effect is increasing pressure for firms to seek
geographical regions with lower cost structures and higher rates of labor
productivity.
Between 1948 and 1994, seven tariff reduction rounds significantly liberalized
world trade among the developed nations. The United States currently has zero
tariffs on one-third of all imports, while the Most-Favored-Nation (MFN) tariff
rate has declined to approximately 4.6 percent.
This trade liberalization has produced increasing import and export penetration
as a share of the U.S. Gross Domestic Product (GDP). Between 1970 and 2000, the
U.S. export share of GDP almost tripled (4.4 percent to 12.3 percent) while the
U.S. import share of the economy more than doubled (6.2 percent to 16.6 percent)
(see Chart 2). Interestingly, the
1990s witnessed the greatest percentage increase in trade penetration, with both
export and import shares rising markedly. This fact will prove interesting
throughout the analysis presented in section VI.
Before the forces of globalization opened the relatively insular U.S. economy to increased trade, U.S. manufacturers were enjoying near monopolistic market conditions in the United States. The U.S. auto industry, for example, enjoyed a 90 percent domestic market share in 1960.
These benign market conditions for U.S. manufacturers in the early post-World
War II period allowed them to pass on higher costs to consumers without a
significant loss in market share. These conditions also permitted organized
labor to thrive, swelling its ranks to one-third of the American workforce by
1955.
Union membership now hovers around 9 percent of the private sector workforce.
Despite organized labor's persistent influence in the national and local
political arena, the forces of globalization continue to shrink its ranks. There
is every reason to believe that these forces will only intensify in the future
as barriers to international trade continue to fall and as relative business
costs play a greater role in regional economic performance. Advances in
information technology, greater capital mobility and lower barriers to entry for
business startups are making it increasingly difficult for businesses to pass on
higher costs to suppliers and customers. The net effect is increasing pressure
for firms to seek geographic regions with lower cost structures and higher rates
of labor productivity.

Nine economic statistics (Gross State Product, employment growth,
manufacturing and construction employment, the unemployment rate, per-capita
disposable income, unit labor costs, poverty rate, and income inequality)
provide the yardstick for comparing economic development between RTW and non-RTW
states. These statistics represent a diverse cross-section of economic data,
providing a multifaceted comparison of economic development between the states.
Contingent upon data availability, results are presented over three decades,
1970 through 2000.2
To show key inflection points for each of the nine statistics, the results are
presented for each decade in Appendix I. In addition to comparing key
differences between RTW and non-RTW states, Michigan's results are presented
separately.
The time series methodology will account for the status change of Louisiana and
Idaho, which became RTW states in 1977 and 1985, respectively. Oklahoma is
classified as a non-RTW state for purposes of this study, since its change to
RTW status is too recent (2001) for the effects to be reflected in the
statistics.
Gross State Product (GSP), the market value of all goods and services
produced in a state, is the broadest measure of a state's economic activity.
Chart 3 summarizes average annual
real GSP growth rates between RTW states, non-RTW states and Michigan from
1977-1999.
Right-to-work states enjoyed a 0.5 percent annual growth advantage over non-RTW
states. This is a considerable growth advantage, particularly when compounded
over 23 years.
Dividing the results into two equal time periods (1977-88 and 1988-99, both of
which include a recession) to discover any changes in relative growth rates
yielded even more distinctions (see Table
I, Appendix I). While the average annual growth advantage held by RTW states
was just 0.1 percent from 1977-88, it accelerated to 1 percent from 1988-99.
Michigan averaged 1.8 percent growth from 1977-99, growing a little more than
half as fast as the average RTW state. Michigan's growth even lagged that of its
sister non-RTW states by more than 1 percent annually. Over this period, only
three states have grown more slowly than Michigan (Montana at 1.6 percent, West
Virginia at 1.3 percent, and Louisiana at 1.4 percent).
While Michigan's annual GSP growth more than doubled during the 1988-99 period,
it still lagged behind the GSP growth of the average RTW and non-RTW states by
significant margins (Michigan's state ranking increased to 36th). While
Michigan's growth did accelerate during this period, that growth was slower than
the average growth in RTW and non-RTW states. Only two RTW states (Wyoming and
Louisiana) failed to grow as fast.

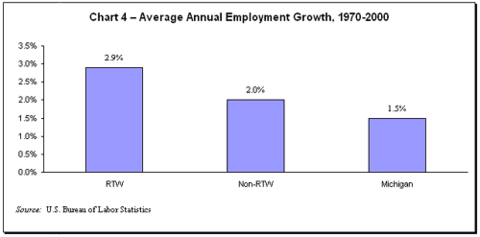
Chart 4 presents average non-farm
payroll employment growth from 1970-2000. Right-to-work states averaged almost 1
percent faster annual growth. Although this difference dissipated temporarily
during the 1980s, it widened significantly during the 1990s (see
Table II, Appendix I).
At 1.5 percent, Michigan's employment growth averaged only half that of RTW
states, placing it 41st in employment growth over this period (surpassed by
every RTW state). Michigan's relative ranking barely improved during the 1990s,
placing it in 35th place, again trailing all 21 RTW states.
Because the manufacturing workforce has much higher rates of unionization
than the overall labor force, the RTW advantage should be even more amplified in
this sector. If compulsory unionism drives up labor compensation levels without
a commensurate rise in productivity, manufacturers will seek more attractive
regions for expansion, leaving non-RTW states with shrinking manufacturing
payrolls.
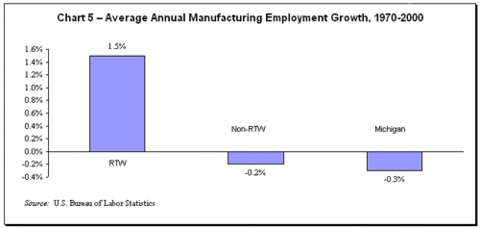
Chart 5 illustrates that this clearly
has been the case. In a period (1970-2000) where total manufacturing employment
dropped by 5 percent nationwide, RTW states augmented their employment base by
1.5 percent annually. Over the 1970-2000 period, RTW states enjoyed a 1.7
percent growth advantage over non-RTW states, a significantly larger margin than
they posted for total payroll employment.
While non-RTW states were cutting manufacturing payrolls by 2.3 million from
1970-2000, RTW states were increasing their blue-collar payrolls by 1.4 million.
The RTW states' share of total manufacturing jobs (see
Chart 6) rose from 25.4 percent in 1970 to 34.3 percent by 2000. Despite the
loss of 875,000 U.S. manufacturing jobs over this period, all of the 21 RTW
states registered a net gain in manufacturing payrolls.
Once a manufacturing powerhouse, Michigan fared poorly even in relation to other non-RTW states, losing over 100,000 manufacturing jobs from 1970 to 2000. Unlike most non-RTW states, however, Michigan's manufacturing payrolls did managed to grow during the 1990s (see Table III, Appendix I), ranking it 23rd in growth among all states.
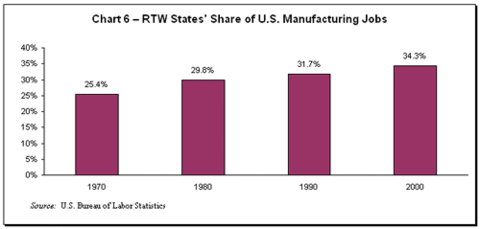
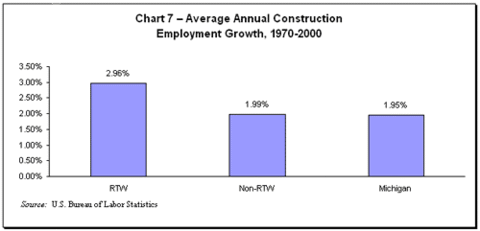
Not surprisingly, RTW states also had almost 1 percent faster construction employment growth over this period. While non-RTW states had higher growth in this category during the 1980s (without Wyoming's 7.5 percent decline, RTW states would have had positive construction job growth), the RTW advantage quickly reasserted itself during the 1990s. Michigan ranked 32nd in the nation (from 1970-2000), averaging 1.9 percent annual growth in construction employment. See Chart 7.
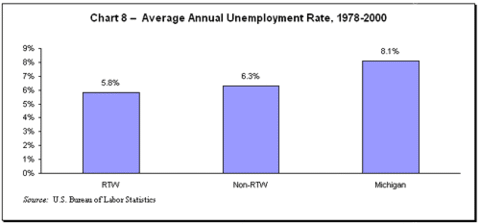
From 1978 through 2000, RTW states had lower average annual unemployment
rates for all but 5 of 23 years. Right-to-work states also weathered the 1990-91
recession better, with unemployment rising only 0.43 percent (from 1990-91)
compared to a 1.13 percent rise for non-RTW states.
The unemployment gap between RTW and non-RTW states dissipated during the 1990s,
reflecting a national trend toward tighter labor markets (and full employment)
in most states. This phenomenon produced labor shortages which were more acute
in RTW states.
Michigan's unemployment rate averaged 8.1 percent from 1970-2000, significantly
higher than the 5.8 and 6.3 percent average for RTW and non-RTW states,
respectively. While Michigan's average rate did fall below the national average
during much of the 1990s, this was more a consequence of slower growth in
Michigan's workforce (i.e., fewer eligible workers), not faster employment
growth. See Chart 8.
Critics of RTW legislation have often acknowledged the faster employment
growth in RTW states, but counter that it comes at the expense of much lower
wages and incomes. Organized labor's mantra, the "right-to-work for less"
or the "right-to-starve," has resonated strongly both inside and outside union
circles.
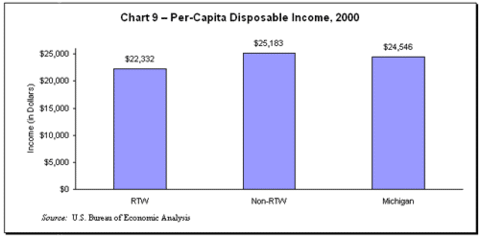
Most economic studies have shown higher nominal or money income in non-RTW
states. Chart 9 confirms that this is
still the case. Per-capita disposable income, the per-person income
available for spending and saving after paying taxes, was approximately 10
percent higher in non-RTW states in 2000.
But this gap in favor of the non-RTW states does not necessarily mean that
purchasing power, or the standard of living, is higher in these states. Higher
nominal incomes may simply reflect a higher cost-of-living. This is, in fact,
precisely what recent research is finding (see Bennett 1994 and Kendrick 2001).
James Bennett, for example, found that a typical family in a RTW state had
$2,852 more in after-tax purchasing power than the same family had in a
non-RTW state (even thought the non-RTW families had higher nominal incomes).4
Besides evidence of greater purchasing power or higher living standards in the
RTW states, there is also hard evidence that the nominal income gap between RTW
and non-RTW states is narrowing. As shown in
Chart 10, per-capita disposable
income grew 0.2 percent faster annually for RTW states over the 1970-2000
period. So while non-RTW states have traditionally held a lead in nominal
income, this gap continues to narrow.
Disposable income is growing faster in RTW states because they have a
flexible work environment in which employers and employees can more easily
respond to market incentives. This produces lower costs, higher productivity,
and greater income and job growth. Businesses increasingly reject "top-down"
management, relying instead upon employee participation in every aspect of a
firm's decision-making process. This inevitably favors a work environment that
is more responsive to the changing needs of both workers and employers.
Employees protected by RTW legislation can quit supporting a union without
quitting their job. Reid and Faith (1987) find that unions in RTW states reward
members more equally and are less concerned with day-to-day administration of
complex bargaining agreements. This makes collective job actions more difficult
and prompts local union leaders to strive more for consensus among their
members. Right-to-work legislation forces a union to bargain more in the
immediate interest of all members because members can withdraw from a union at
any time without cost to themselves.
Rigid union-negotiated employee contracts typically have the perverse effect of
reducing the pay of the most productive workers while increasing compensation
for less productive workers. Any system that grants union officials the legal
power to impose unwanted union representation on its most productive workers,
and then forces them to pay for it, ultimately lessens the income and standard
of living of all its citizens.
Michigan, ranking fourth in the nation in private-sector union membership (as a
percent of the private workforce in 2001), matched the non-RTW state average in
disposable income growth.
Unit labor costs measure labor compensation relative to labor productivity.
Defined as compensation per unit of real output (see
Appendix II for a detailed
description of this index), unit labor costs are a better indication of business
profitability than labor compensation alone, and are the most crucial component
of the cost of doing business within a geographical region.
Labor compensation growth, over time, is directly linked to growth in labor
productivity. A workforce that is producing more output per person (i.e., higher
productivity) will experience higher growth in real earnings. This growth in
real earnings will not jeopardize a region's business competitiveness when
matched by commensurate productivity gains. Growth in labor compensation that is
not matched by productivity gains, conversely, will result in higher unit labor
costs and deteriorating business competitiveness.
Relative business costs have been a major factor affecting regional economic
performance. As U.S. businesses find it increasingly difficult to raise prices
due to greater competition from both home and abroad, relative business costs
will likely play an increasingly important role in business location decisions.
States or regions that maintain uncompetitive unit labor costs will see an exit
of capital and business formation to more competitive regions.
Table VII in Appendix I shows the
time series of unit labor costs for each state and the District of Columbia from
1990 through 2000. Not surprisingly, the results show a clear pattern of higher
unit labor costs in non-RTW states during the past decade. According to
Economy.com, only three RTW states in 2000-Florida, Utah and Virginia-had unit
labor costs above the national average (U.S.=100) while 11 non-RTW states
exceeded the average. In 2000, RTW and non-RTW states' unit labor costs averaged
93.2 and 98.1, respectively. Uncompetitive at the start of the decade,
Michigan's unit labor costs rose to 109.2 by 2000, ranking it second in the
nation behind New Jersey. See Chart
11.
The U.S. Bureau of Labor Statistics defines the poverty rate as the
percentage of people who live in households with cash incomes below the "poverty
line." This line is not a fixed dollar amount but varies by family size and
type. For example, the poverty line for a single person in 2001 was $9,044 and
$18,104 for a typical family of four.
The U.S. poverty rate fell between 1949 and 1969, from 39.7 percent to 14.4
percent. The official poverty rate reached a historic low in 1973, then stopped
falling. Between that year and 2000, the poverty rate rose from 11.1 percent to
11.3 percent.
While the poverty rate failed to drop nationwide over the past three decades, it
showed a distinctly different pattern in the RTW states. Starting with much
higher poverty rates (averaging 18.3 percent in 1969), by 2000 RTW states had
dropped sharply their average rate to 11.6 percent, placing the poverty rate
only 0.3 percent higher than the U.S. poverty rate. All 21 RTW states'
(including Louisiana and Idaho) poverty rates have declined over the past 30
years. Based on the U.S. Bureau of Labor Statistics' decennial survey from the
past four decades, the poverty rate declined 6.7 and 2.0 percent for RTW and
non-RTW states, respectively, from 1969 to 2000. See
Chart 12. See
Table VIII, Appendix I for actual
poverty rates.
Michigan's poverty rate showed a disturbing 0.6 percent rise over this same
period, ranking it 45th overall in poverty rate improvement. Michigan is one of
seven states, all non-RTW, whose poverty rate actually increased over the past
30 years.
In section F we found faster growth in disposable income in RTW states. In
this section we examine income inequality to more accurately
determine changes in the distribution of income.
Neither economic theory nor history suggests that a market economy should lead
to an even distribution of earnings. In free markets, prices adjust to equate
supply and demand. When demand for skilled workers outstrips supply, the wages
of those at the top of the distribution grow faster than the wages of those at
the bottom.
In other words, rising income inequality is not necessarily an unhealthy sign in
a growing economy. Such a rise occurred in the second half of the 1800s, a
period of strong economic growth and rising real incomes for most Americans.
Falling income inequality, conversely, is not necessarily positive. Inequality
remained relatively high going into the 20th century but declined rapidly during
the Great Depression. Nevertheless, income inequality, examined in context with
the other statistics, may yield some additional insight into the differences
between RTW and non-RTW states.
Income inequality, as measured by the Gini Coefficient (see Appendix III), ranges from zero to one, with zero indicating perfect income equality (all income distributed equally to all households) and one indicating perfect income inequality (all income accruing to one household). The Gini Coefficients for RTW states, non-RTW states and Michigan are shown in Chart 13 for 1977 (first year available) and 2000. See Table IX in Appendix I for the Gini Coefficient for the years 1977, 1985, 1993 and 2000.5
Like poverty rates, income inequality started significantly higher in RTW
states.6
While inequality rose for both over the past quarter century (as a trend, it has
risen in the United States), it has risen significantly faster for non-RTW
states. By 1992, the positions had reversed: RTW states had, on average,
lower income inequality than non-RTW states.
Lower income inequality in the RTW states would have seemed unthinkable a
generation ago. A quarter century of superior economic growth in the RTW states
adds to the increasing evidence that economic growth is the best way to raise
the incomes of all Americans.
Michigan's Gini coefficient rose from .387 to .436 over the same period. In
1977, the state ranked 17th in income inequality (i.e., 16 states had lower
income inequality). Michigan's income inequality widened rapidly during late
1970s and early 1980s, and by 1985, its state ranking had dropped to 33rd. Since
then, however, Michigan's income inequality has risen less rapidly than most
states. By the turn of the millennium, its state ranking had risen to 18th.7
These results contradict the widely held belief that the presence of unions and
the power of collective bargaining mitigate income inequality by distributing
earnings more evenly. Although this may be true within individual unionized
companies, it is not true for any state's economy as a whole. The favorable
economic climate produced by RTW laws appears to be responsible for general
income growth that benefits all workers and reduces income disparity.
Right-to-work laws were enacted by states primarily to attract and to promote
economic growth. This study, employing a large cross-section of economic
indices, finds a broad-based trend of superior economic development in RTW
states over the past three decades.
The comparative statistics on income growth, unit labor costs and poverty rates
are the most novel and interesting. Until now, organized labor has stressed the
necessity of compulsory union support as a countervailing force against
corporate power and rising income inequality. Although they have often derided
RTW laws as "right-to-work for less," advocates of compulsory unionism have no
economic basis upon which to support that claim.
The RTW economic growth advantage clearly accelerated during the 1990s. Poverty
fell further; disposable income grew faster and manufacturing employment
expanded in RTW states. There is a strong possibility that this widening in
economic development will only continue in the future. Heightened competition,
both at home and from abroad, has increased the importance for firms of finding
regions with a flexible labor environment and lower cost structures. The advent
of the Internet, advances in information technology, lower barriers to entry for
most industries, and the increased mobility of financial capital all favor
states with RTW legislation.
Table 2 summarizes Michigan's
ranking, vis-à-vis all 50 states, over the 1970-2000 period with a separate
listing for the 1990s. The state rank is enumerated so that the higher the
ranking, the better the economic performance. The 1990s were singled out because
the decade is widely regarded as a period of "superior" performance for the
state's economy.
Michigan's relative economic performance over the past three decades was
dismal, finishing in the bottom quintile in economic and employment growth, unit
labor costs and poverty rate improvement. Interestingly, with the exception of
per-capita personal income growth (for which it was tied) and income inequality,
Michigan performed worse in every category vis-à-vis the average non-RTW state.
More worrisome, however, are the startling statistics on Michigan's unit labor
costs. As the forces of globalization and competition intensify, Michigan's high
unit labor costs will increasingly discourage fresh capital from planting new
seeds.
While the 1990s brought some very modest improvement in Michigan's relative
standing, it was hardly a decade of economic superiority. The state continued
its three-decade tradition of below-average growth in output, employment and
income. The recipient of key economic headwinds, Michigan's relative economic
performance should have excelled during the 1990s. Relatively low energy prices
and interest rates were a boon to the state's heavy industry. The exchange value
of the dollar, significantly weaker since the 1980s, was a boost to state
exporters (Michigan is a major exporter). Equally important, the Big Three
automakers, riding the wave of light-truck mania, registered record sales and
profits.
Interestingly, the 1990-91 recession also favorably impacted Michigan's relative
growth statistics. With economic growth contracting more here than in most
states during the late 1980s and the 1990-91 recession, Michigan's economic
recovery came off a relatively low base, biasing its growth figures upward.
Michigan's ensuing cyclical recovery (1991-1999) should have produced much more
robust economic growth. Instead, Michigan still lagged behind RTW states.
Communism as a political philosophy eventually died because it couldn't "deliver
the goods." Like communism, compulsory union support hasn't delivered the goods
but has managed to survive in the majority of states. This paper shows a clear
correlation between economic growth and RTW status. Corroborated by a growing
body of research conducted by many independent scholars, the compelling
conclusion is that RTW laws increase state economic development and overall
prosperity.
|
Economic Variable |
Year(s) |
State Rank |
|
| Gross State Product | 1977-1999 | 47 | |
| 1988-1999 | 36 | ||
| Employment Growth | 1970-2000 | 41 | |
| 1990-2000 | 35 | ||
| Manufacturing Employment Growth | 1970-2000 | 37 | |
| 1990-2000 | 23 | ||
| Construction Employment Growth | 1970-2000 | 32 | |
| 1990-2000 | 18 | ||
| Unemployment Rate | 1978-2000 | 47 | |
| 1990-2000 | 14 | ||
| Per-Capita P.I. Growth | 1970-2000 | 34 | |
| 1990-2000 | 22 | ||
| Unit Labor Costs | 2000 | 49 | |
| 1990 | 48 | ||
| Poverty Rate Improvement | 1969-2000 | 45 | |
| Income Inequality | 1977 | 17 | |
| 2000 | 18 |
1Paragraph provided by the Bureau of Labor
Statistics' "Union Members Summary 2001."
2RTW and non-RTW summary statistics are
weighted by the number of states in each category (typically 29 and 21 for non-RTW
and RTW, respectively).
31999 was the last year available as of this
writing.
4Lacking cost-of-living data by state, Bennett
used Consumer Price Index data from a large number of metropolitan areas to
compare RTW versus non-RTW states.
5The Census Bureau's decennial survey data on
family income starts in 1969 but the most recent survey (i.e. - 1999) is
currently unavailable. The series from the household survey (used in the
study), conversely, has data for 2000 but dates back only to 1977. The annual
series from the Current Population Survey is not interchangeable because the
series uses a different scale than the decennial survey.
6The poverty gap between RTW and non-RTW states
was even greater in earlier periods. The U.S. Census Bureau's 1969 decennial
survey shows Gini coefficients of .372 and .348 for RTW states and non-RTW,
respectively.
7But in the decennial survey on family
income, Michigan has the distinction of having the greatest increase in income
inequality among all 50 states from 1969 through 1989, with the Gini coefficient
rising from .329 to .395.
| RTW | Non-RTW | Overall Difference | Michigan | |
| 1977-1988 | 3.1% | 3.0% | 0.1% | 1.1% |
| 1988-1999 | 3.8% | 2.8% | 1.0% | 2.5% |
| 1977-1999 | 3.4% | 2.9% | 0.5% | 1.8% |
| RTW | Non-RTW | Overall Difference | Michigan | |
| 1970-79 | 4.4% | 2.9% | 1.5% | 2.2% |
| 1980-89 | 2.0% | 1.9% | 0.1% | 1.5% |
| 1990-2000 | 2.6% | 1.6% | 1.0% | 1.7% |
| 1970-2000 | 2.9% | 2.0% | 0.9% | 1.5% |
| RTW | Non-RTW | Overall Difference | Michigan | |
| 1970-79 | 3.4% | 1.2% | 2.2% | 0.8% |
| 1980-89 | 0.7% | -0.6% | 1.3% | -0.3% |
| 1990-2000 | 1.0% | -0.6% | 1.6% | 0.4% |
| 1970-2000 | 1.5% | -0.2% | 1.7% | -0.3% |
| RTW | Non-RTW | Overall Difference | Michigan | |
| 1970-79 | 5.7% | 2.8% | 2.9% | 1.8% |
| 1980-89 | -0.3% | 2.4% | -2.7% | 2.0% |
| 1990-2000 | 4.4% | 2.5% | 1.9% | 4.0% |
| 1970-2000 | 3.0% | 2.0% | 1.0% | 1.9% |
| RTW | Non-RTW | Overall Difference | Michigan | |
| 1980 | 6.20% | 7.30% | 1.10% | 12.40% |
| 1990 | 5.20% | 5.60% | 0.40% | 7.60% |
| 2000 | 3.80% | 4.00% | 0.20% | 3.60% |
| RTW | Non-RTW | Overall Difference | Michigan | |
| 1970-79 | 10.0% | 9.4% | 0.6% | 9.6% |
| 1980-89 | 6.7% | 6.9% | -0.2% | 6.5% |
| 1990-2000 | 4.0% | 3.8% | 0.2% | 4.0% |
| 1970-2000 | 6.8% | 6.6% | 0.2% | 6.6% |
| 1990 | 1991 | 1992 | 1993 | 1994 | 1995 | 1996 | 1997 | 1998 | 1999 | 2000 | |
| Alaska | 90.5 | 91.2 | 91.0 | 91.1 | 91.5 | 92.1 | 92.9 | 92.8 | 91.8 | 91.0 | 90.9 |
| Alabama | 93.9 | 94.9 | 94.7 | 94.7 | 95.5 | 96.2 | 96.6 | 96.7 | 97.0 | 96.8 | 96.7 |
| Arkansas | 88.7 | 88.4 | 88.5 | 87.8 | 87.5 | 87.8 | 87.8 | 88.2 | 88.8 | 89.8 | 90.5 |
| Arizona | 104.6 | 106.0 | 103.8 | 101.2 | 97.9 | 96.3 | 96.2 | 96.8 | 98.0 | 98.5 | 98.7 |
| California | 103.0 | 102.5 | 102.4 | 102.8 | 102.9 | 102.4 | 102.7 | 102.7 | 102.7 | 102.1 | 101.9 |
| Colorado | 104.1 | 104.3 | 104.5 | 103.9 | 103.3 | 103.3 | 104.2 | 103.8 | 103.3 | 103.0 | 103.7 |
| Connecticut | 107.1 | 105.9 | 105.6 | 105.6 | 105.4 | 105.0 | 105.6 | 106.5 | 106.6 | 106.5 | 106.1 |
| District of Columbia | 111.8 | 112.1 | 112.6 | 111.4 | 109.8 | 109.1 | 109.7 | 110.8 | 110.5 | 112.1 | 113.8 |
| Delaware | 89.7 | 88.3 | 87.3 | 86.5 | 87.2 | 88.0 | 89.3 | 90.7 | 92.9 | 94.7 | 95.7 |
| Florida | 101.0 | 101.4 | 101.7 | 101.5 | 101.5 | 101.0 | 100.8 | 100.4 | 100.9 | 101.1 | 101.3 |
| Georgia | 98.9 | 98.6 | 97.9 | 96.6 | 95.9 | 95.4 | 94.9 | 94.9 | 95.4 | 96.0 | 96.3 |
| Hawaii | 95.4 | 95.1 | 95.4 | 97.5 | 98.9 | 99.1 | 98.6 | 98.6 | 98.8 | 98.7 | 98.4 |
| Iowa | 81.0 | 80.8 | 81.0 | 82.0 | 82.7 | 83.7 | 83.1 | 82.2 | 82.6 | 85.1 | 88.1 |
| Idaho | 88.3 | 89.9 | 91.3 | 90.5 | 89.6 | 89.2 | 89.8 | 90.6 | 91.4 | 92.4 | 92.5 |
| Illinois | 100.7 | 100.6 | 100.8 | 101.5 | 101.3 | 102.0 | 101.3 | 101.6 | 101.7 | 102.6 | 103.5 |
| Indiana | 95.8 | 96.2 | 96.3 | 96.5 | 96.7 | 97.8 | 98.3 | 98.1 | 97.6 | 98.5 | 99.3 |
| Kansas | 87.4 | 87.2 | 87.6 | 89.7 | 91.2 | 93.1 | 93.6 | 94.1 | 93.8 | 94.2 | 94.5 |
| Kentucky | 86.3 | 87.1 | 88.3 | 88.9 | 89.2 | 89.5 | 90.1 | 90.9 | 91.5 | 92.0 | 92.3 |
| Louisiana | 85.2 | 85.6 | 87.3 | 90.0 | 91.6 | 90.6 | 89.9 | 89.7 | 91.3 | 91.9 | 92.4 |
| Massachusetts | 108.5 | 108.3 | 109.2 | 108.9 | 108.8 | 108.4 | 108.7 | 109.7 | 109.8 | 109.4 | 108.7 |
| Maryland | 98.7 | 99.2 | 100.2 | 101.3 | 102.3 | 103.1 | 103.6 | 104.0 | 103.7 | 103.4 | 103.1 |
| Maine | 99.4 | 99.8 | 99.8 | 98.8 | 99.0 | 98.4 | 98.6 | 98.1 | 98.6 | 99.0 | 99.5 |
| Michigan | 105.2 | 105.0 | 105.8 | 106.4 | 106.9 | 107.6 | 108.4 | 108.7 | 109.2 | 109.1 | 109.2 |
| Minnesota | 98.0 | 98.3 | 99.4 | 101.0 | 101.6 | 102.6 | 102.2 | 101.2 | 99.8 | 98.6 | 98.4 |
| Missouri | 96.2 | 96.3 | 96.4 | 97.0 | 97.7 | 98.1 | 97.3 | 96.8 | 96.5 | 97.1 | 97.6 |
| Mississippi | 84.0 | 84.7 | 84.6 | 84.7 | 85.4 | 86.6 | 87.5 | 88.6 | 90.5 | 92.0 | 92.8 |
| Montana | 86.2 | 85.2 | 85.5 | 85.9 | 87.1 | 88.2 | 89.7 | 89.8 | 89.7 | 89.5 | 89.6 |
| North Carolina | 94.2 | 94.1 | 95.0 | 95.6 | 96.1 | 96.2 | 96.8 | 96.8 | 97.2 | 96.1 | 95.5 |
| North Dakota | 87.3 | 85.7 | 84.9 | 87.3 | 88.1 | 90.4 | 89.5 | 90.6 | 90.1 | 92.0 | 92.5 |
| Nebraska | 85.9 | 84.5 | 84.0 | 84.9 | 85.0 | 84.6 | 81.0 | 80.2 | 80.1 | 82.2 | 82.5 |
| New Hampshire | 100.3 | 99.3 | 97.6 | 96.5 | 97.8 | 97.6 | 96.9 | 96.2 | 96.1 | 95.7 | 94.5 |
| New Jersey | 108.5 | 108.6 | 108.1 | 106.7 | 106.4 | 106.3 | 107.5 | 108.5 | 109.7 | 110.1 | 110.4 |
| New Mexico | 100.9 | 94.1 | 88.2 | 79.9 | 76.4 | 75.5 | 77.2 | 78.7 | 78.2 | 77.0 | 76.1 |
| Nevada | 93.8 | 94.1 | 94.5 | 94.0 | 93.7 | 92.9 | 93.5 | 94.0 | 94.8 | 96.0 | 96.6 |
| New York | 103.4 | 104.2 | 103.8 | 104.0 | 103.8 | 103.8 | 103.5 | 103.7 | 103.3 | 102.8 | 101.7 |
| Ohio | 98.1 | 97.1 | 96.7 | 97.8 | 98.4 | 99.0 | 98.4 | 97.9 | 97.5 | 97.3 | 97.4 |
| Oklahoma | 82.9 | 82.2 | 81.4 | 81.5 | 81.8 | 82.1 | 82.1 | 81.8 | 82.3 | 82.8 | 83.1 |
| Oregon | 99.8 | 100.4 | 100.0 | 99.8 | 99.9 | 99.5 | 98.1 | 97.1 | 96.0 | 96.5 | 95.5 |
| Pennsylvania | 102.9 | 102.1 | 101.1 | 100.1 | 100.2 | 99.6 | 99.7 | 99.3 | 100.1 | 100.6 | 100.8 |
| Rhode Island | 99.5 | 97.4 | 95.9 | 93.8 | 94.2 | 94.5 | 94.4 | 91.3 | 91.1 | 90.2 | 90.7 |
| South Carolina | 95.6 | 96.0 | 96.9 | 96.9 | 97.1 | 96.0 | 96.0 | 96.3 | 97.2 | 97.9 | 98.6 |
| South Dakota | 68.4 | 67.6 | 66.8 | 65.8 | 65.8 | 66.1 | 66.7 | 67.6 | 68.4 | 70.4 | 71.9 |
| Tennessee | 96.5 | 96.9 | 95.8 | 94.2 | 94.1 | 95.4 | 96.9 | 98.3 | 98.6 | 98.5 | 98.4 |
| Texas | 93.6 | 94.0 | 94.7 | 94.7 | 94.0 | 93.5 | 94.2 | 94.5 | 95.5 | 95.8 | 96.7 |
| Utah | 101.9 | 101.6 | 101.5 | 103.0 | 105.1 | 105.4 | 102.7 | 100.5 | 99.3 | 100.4 | 100.2 |
| Virginia | 99.8 | 99.6 | 99.6 | 99.4 | 99.6 | 99.4 | 99.6 | 99.9 | 100.1 | 101.1 | 101.7 |
| Vermont | 91.9 | 92.2 | 92.3 | 92.5 | 93.0 | 94.4 | 95.7 | 96.1 | 96.3 | 96.6 | 97.2 |
| Washington | 94.5 | 94.9 | 96.1 | 96.6 | 97.6 | 98.3 | 100.6 | 102.6 | 103.8 | 104.2 | 103.6 |
| Wisconsin | 94.9 | 95.8 | 96.9 | 97.4 | 98.2 | 99.0 | 99.7 | 99.6 | 99.0 | 99.1 | 99.0 |
| West Virginia | 92.5 | 92.7 | 93.2 | 93.1 | 92.7 | 92.6 | 92.6 | 93.0 | 93.3 | 93.9 | 94.5 |
| Wyoming | 78.2 | 77.6 | 78.6 | 80.0 | 82.1 | 81.5 | 79.9 | 77.9 | 77.1 | 77.8 | 78.5 |
| U.S. = 100 | |||||||||||
| Source: Economy.com | |||||||||||
| RTW | Non-RTW | Overall Difference | Michigan | |
| 1969 | 18.3% | 12.2% | -6.1% | 9.4% |
| 1979 | 14.2% | 11.3% | -2.9% | 10.4% |
| 1989 | 14.9% | 11.7% | -3.2% | 13.1% |
| 2000 | 11.6% | 10.2% | -1.4% | 10.0% |
| RTW | Non-RTW | Michigan | |
| 1977 | 0.405 | 0.388 | 0.387 |
| 1985 | 0.416 | 0.406 | 0.417 |
| 1993 | 0.432 | 0.437 | 0.433 |
| 2000 | 0.443 | 0.453 | 0.436 |
Unit Labor Cost Calculation - Provided by Economy.com
The wage and output data for both the states and metropolitan areas come from
the U.S. Bureau of Economic Analysis (BEA) and the U.S. Bureau of the Census,
with missing data estimated by Economy.com. The labor compensation measure used
is total wages and salaries by place of work, divided by total employment in
each industry. Productivity per worker for metropolitan areas is estimated by
applying the 1992 ratio of metropolitan to state level productivity to the gross
state product release of the BEA. This ratio is calculated using data on
revenues and costs obtained from the 1992 Economic Census.
Since relative regional economic growth is most influenced by enhancing local
production of exportable goods and services, industries predominantly driven by
local demand have been excluded from the analysis. These industries are
primarily retail trade, construction, real estate, many service industries, and
the government sector. In order to compare different regions properly,
Economy.com constructed separate indices of worker productivity and earnings per
worker for each metropolitan area, covering employment for each export industry
at the three-digit Standard Industrial Classification level. However, a measure
that used the aggregate output and earnings per worker would be biased by the
region's industrial composition. Thus, the index of unit labor costs
re-aggregates productivity and compensation per employee, using the national
share of employment in each industry as the weights. This adjustment is
necessary because certain industries have higher output per earnings ratios, due
to the occupational mix of its employment and the capital structure of its
operations. For example, productivity in the automotive industry is extremely
high compared to other industries, whereas in the textile industry it is
relatively low. As a result of these industry differences, a region with a high
proportion of automotive manufacturing will appear to have lower unit labor cost
than a region concentrated in textiles. However, by using the national share of
employment in each industry to weight the productivity for each region, the
index avoids this industry composition bias.
Employment composition is based upon SIC employment classifications. Economy.com
uses three-digit SIC data in order to gauge the regional industry mix properly.
However, since data in industries with a particularly small number of employees
are subject to a higher degree of inaccuracy, a minimum size of 100 employees
was imposed on the index. If the industry had fewer than the necessary 100
employees in the metropolitan area, then the relevant state labor cost measure
was used.
The formula below is used to calculate Economy.com's wages and salary and
productivity index for any level of aggregation, which weights each three-digit
SIC equally for each area, with national employment share for each year serving
as weights. This composition-adjusted aggregate is then indexed by the
appropriate state earning or productivity measure. Labor costs are then
calculated by dividing the earnings index by the analogous productivity index.
The unit labor cost index was created for each year by dividing the region's
unit labor cost index by the national unit labor cost index.
Definition of Relative Earnings or Productivity Indexes

Where:
Y = Output or Earnings
St = State or Region
K = Total for all industries
k = Three-digit SIC industry
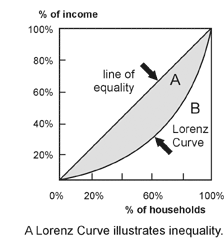
The Gini Coefficient is a summary measure that captures the deviation shown in the Lorenz curve. It is calculated as follows: 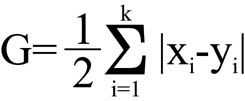
where xi and yi are the relative frequencies, rather than the cumulative frequencies, and k is the number of classes/groups.
The Gini Coefficient can be expressed graphically with the Lorenz curve, where: G = A/(A+B), where A is the area between the line of equality and the Lorenz curve, and B is the area under the Lorenz curve.
Bennett, James. "A Higher Standard of Living in Right-To-Work States."
National Institute for Labor Relations Research, 1994. Springfield,
Virginia.
Calzonetti, FJ. and Robert T. Walker. Factors Affecting Industrial Location
Decisions: A Survey Approach." In Industry Location and Public Policy.
Edited by Henry W. Herzog Jr. and Alan M. Schlottman. Knoxville: University of
Tennessee Press, 1991: pp. 221-40.
Cappelli, Peter and John Chalyoff. "The Effects of Management Industrial
Relations Strategy: Results of a Recent Survey." Proceeding of the
Thirty-Eighth Annual Meeting. Madison, WI: Industrial Relations Research
Association, 1985: pp. 171-80.
Cobb, James C. The Selling of the South. Baton Rouge, La: Louisiana State
University Press, 1982.
Faith, Roger L. and Joseph D. Reid, Jr. "Right-to-Work and Union Compensation
Structure." Journal of Labor Research, Spring 1987.
Holmes, Thomas J. "The Effects of State Policies on the Location of Industry:
Evidence from State Borders." Federal Reserve Bank of Minneapolis, Research
Department, Staff Report No. 205. September, 1996.
Kendrick, David. "Midwest Right-to-Work States still Outperform Forced Union
States in Jobs & Real Income." National Institute for Labor Relations
Research, 2001. Springfield, Virginia.
Kochan, Thomas A., Robert B. McKersie, and John Chalyoff. "The Effects of
Corporate Strategy and Workplace Innovation on Union Representation."
Industrial and Labor Relations Review 39, July 1986: pp. 487-501.
Moore, William J. "The Determinants and Effects of Right-To-Work Laws: A Review
of the Recent Literature." Journal of Labor Research, Summer 1998: pp.
445-469.
Moore, William J." The Effects of Right-to-work Laws: A Review of the
Literature." Industrial and Labor Relations Review 38, July 1985: pp.
571-85.
Newman, Robert J. "Industry Migration and Growth in the South." Review of
Economics and Statistics 65, February 1983: pp. 76-86.
Reder, Melvin W. "The Rise and Fall of Unions: The Public Sector and the
Private." Journal of Economic Perspectives 2, Spring 1988: pp. 89-110.
Schmenner, Roger W. Making Business Location Decisions. Englewood Cliffs,
NJ: Prentice Hall, 1982.